How to access Performance Monitor and Resource Monitor in Windows XP/Vista/7/8.1/10
The Performance Monitor (PM), previously called the Reliability and Performance Monitor, provided by Windows XP, Vista, Windows 7/8.1/10, allows the user to view how the computer reacts while different programs are running or fail to run. By using this tool, it is possible to determine how a particular computer performs over time. The information it provides can then be used for troubleshooting purposes and to improve performances.
The quickest method to access the Performance Monitor is to enter perfmon, perfmon.exe or perfmon.msc in the Run box in XP and in the Search… box in Vista, Win7 and Win10. A link called perfmon.exe is provided above the Search box. Windows 8.1 makes accessing Performance Monitor a little more difficult due to being split into a tiled Start screen and a standard Windows Desktop screen. The easiest way in 8.1 is to open Run by pressing the Windows Key (the one with the Windows flag on it) plus the R key and type perfmon.
The initial window that is presented, shown in the image below in Windows 7, can only hint at the massive amount of information that can be accessed – thousands of monitoring options. Note that Vista’s version of the PM is nearly identical to Win7’s, as is Win8’s version. XP’s is similar, but more simple.

Windows calls the thousands of monitoring options counters, since each one of them counts the various sets of performance data.
PM includes hundreds of counters, many of which can be used more than once in the same monitoring session, such as monitoring the cores (dual-, quad-, hexa-cores, etc.) of a multi-core processor, the hard disk or SSD drives in a system with more than a single drive and even the network traffic on computers that have more than one connection, etc.
PM can display the vast amount of data it generates in real-time charts and graphs or store that information in log files that can be used for troubleshooting. You can set up the PM to track a specific set of counters and then run the computer in such a way that what you want data on is tracked.
Unfortunately, choosing and setting up the correct counters and logs to monitor what you want to monitor can be complicated. Moreover, watching the running counters in order to catch trouble in the act is not always possible. The tool can be used to monitor almost any performance metric you could think of, but you’ll probably find that doing so is fiendishly complex.
There are plenty of articles that provide detailed information on how to use the Performance Monitor on Microsoft’s Technet site. You can use the following link to search for them.
https://technet.microsoft.com/
Performance Monitor Tutorial for Windows [Windows 7] –
The Resource Monitor (ResMon) in Windows 7/8.1/10
Fortunately, the Resource Monitor (ResMon), found only in Windows 7/8.1/10, shown in the image below, is a tool within Performance Monitor that gathers together a collection of some of PM’s most important counters, which is relatively simple to use, making it possible to view at a glance what is happening with the computer’s processor, hard disk or SSD drive, the RAM memory, a home network, etc.
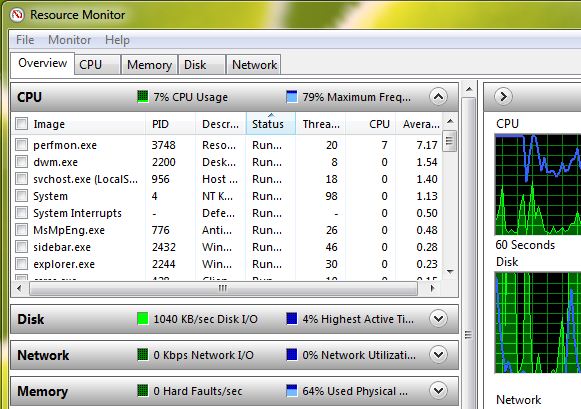
To use the Resource Monitor, in Win7 to Win 10, press the Windows key plus the R key to bring up the Run box and type resmon in it. You can also type resmon in the Search… box and click on the resmon.exe link that is provided above it. Now watch what happens in the Resource Monitor as you use the computer to run a program, search for a file, go online, etc.
The CPU tab displays the aggregate usage, providing statistics and graphs for the computer’s processor (or each of the processor’s cores if it is a multi-core processor).
The Disk tab displays the overall data throughput and how responsive the hard disk drive(s) is/are.
The Network tab displays the type and number of connections in use and the data throughput of each active connection.
The Memory tab displays how much system RAM is in use and which programs are making use of it.
Most of the labels, etc., provide tips or balloon help information when the mouse pointer is hovered over them. The usual Help menu also provides access to detailed information.
The Resource Monitor can be used to find out about and cure a system hang or slowdown. Even just running the monitor in a specific way can make Windows fix the problem automatically.
There are plenty of articles that provide detailed information on how to use the Reliability Monitor on Microsoft’s Technet website, such as how to use it for troubleshooting problems. You can use the following link to search for them.
https://technet.microsoft.com/
Windows – Resource Monitor Tutorial –